Trading Indicators – What They Are & How Traders Use Them: Explained Simply
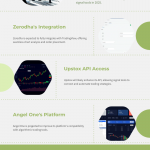
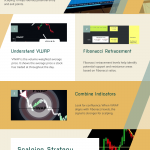
This infographic by Quanzee breaks down trading indicators in a clear and beginner-friendly way. It explains what indicators are, how they are calculated, and why traders rely on them to understand price movement and market behavior. The visual narrative introduces common indicators such as moving averages, RSI, and MACD, showing how they help traders spot trends, momentum, and possible reversals. Instead of focusing on complex math, the infographic emphasizes practical use—how traders read indicator signals to support their decisions. By showing indicators alongside price charts, Quanzee helps users see how raw market data turns into actionable insight. The project is designed to help new and retail traders build confidence and understand indicators as tools for clarity, not prediction.